Introduction
A micro motor datasheet rarely tells an OEM engineering team what it needs to know: how long the motor will actually run in the product, and how confident anyone can be in that number. Lifespan testing on a dedicated life test bench closes that gap. The bench applies a defined duty cycle to a sample of motors, records performance until each unit fails or reaches a censoring time, and turns those records into a life statement with a stated confidence level.
The purpose of this article is to describe how to run that test so the result survives scrutiny — by an internal design review, a customer’s supplier audit, or a notified body. It covers brushed DC and BLDC micro DC motors, including the coin-format vibration motors used for haptic feedback, because the same statistical logic applies whether the wear-out mechanism is brush erosion, bearing fatigue, or a worn eccentric weight bushing.
The scope runs from bench design through duty profiles, reliability modeling, and reporting. Two worked report examples accompany this method — a BLDC coin vibration motor and a micro LRA vibration motor. Both are available as PDF downloads further down, and they should be read alongside the method described here, since a life number means little without the test conditions that produced it.
The keyword focus throughout is micro motor lifespan testing methods and data for reliability. That phrasing is deliberate: methods and data belong together. A method without data is a procedure; data without a documented method is an anecdote.
Key Takeaway A lifespan claim is only as credible as the test design, the duty profile, and the statistical treatment behind it. Plan all three before the first motor is mounted.
One framing point before the detail. A life test bench is not a quality inspection station. Inspection asks whether a unit meets specification today. A life test asks when and how units stop meeting it, and at what rate. The two use overlapping equipment but answer different questions, and conflating them is one of the most common reasons a qualification package fails review.
Test Design and Instrumentation
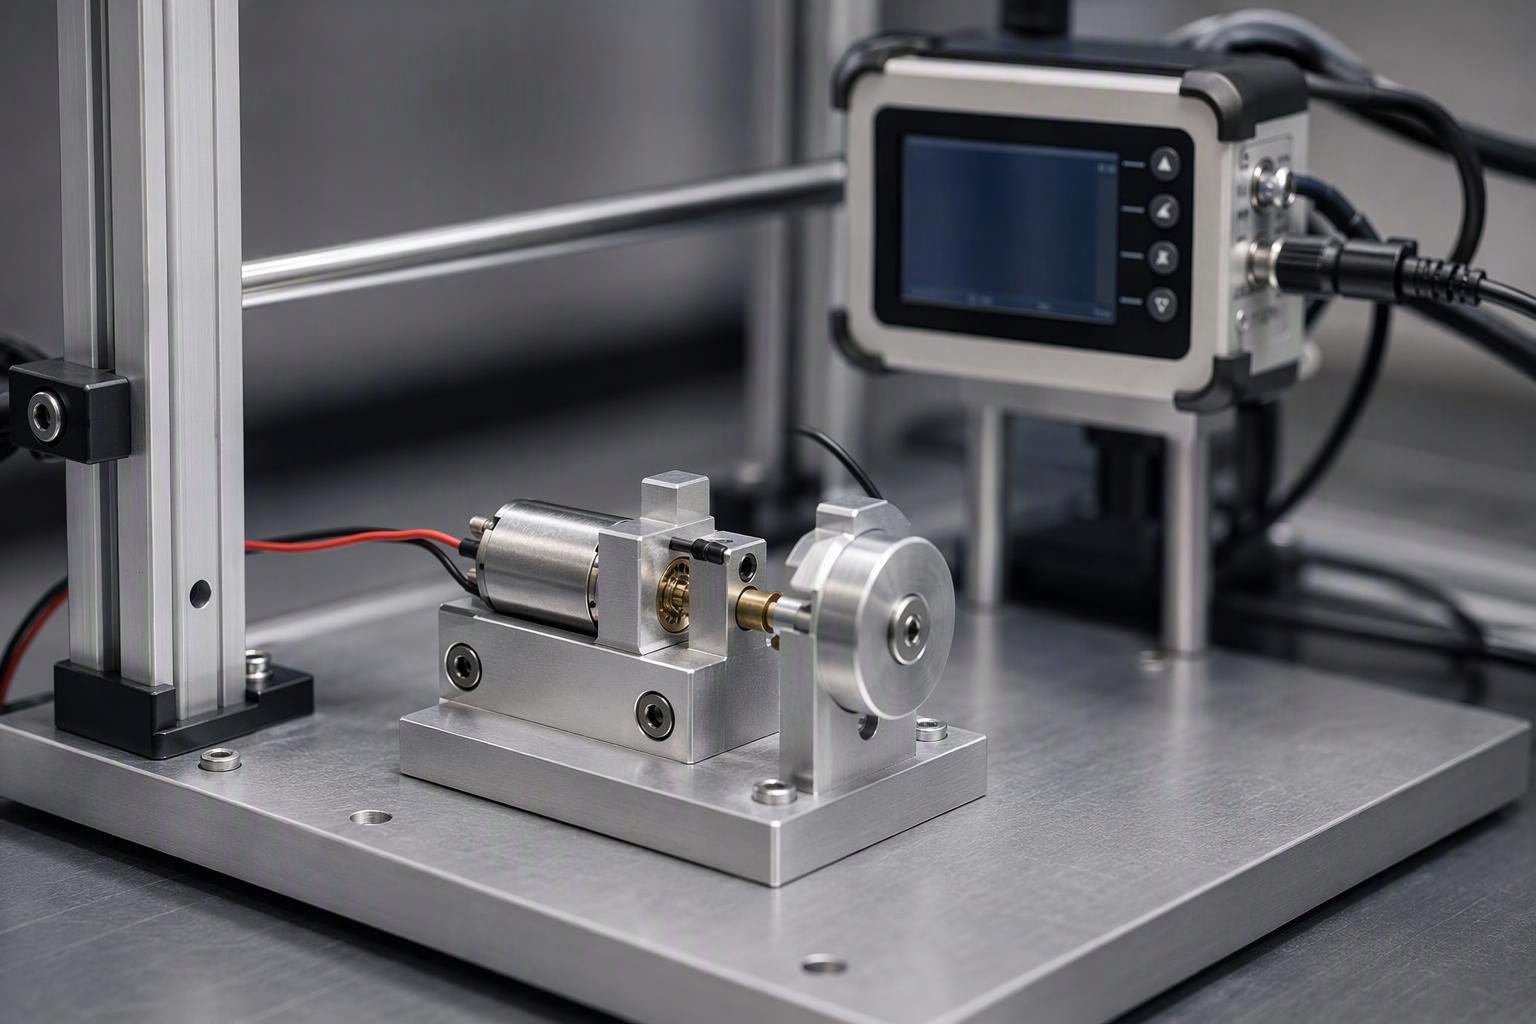
The bench determines what the data can support. A test rig that cannot hold load constant, or that drifts in its measurement chain, produces life data whose scatter reflects the rig rather than the motor.
Fixtures and dynamometers
A life test fixture has three jobs: hold the motor in a repeatable position, apply the intended load, and let the motor be removed and replaced without disturbing the measurement setup.
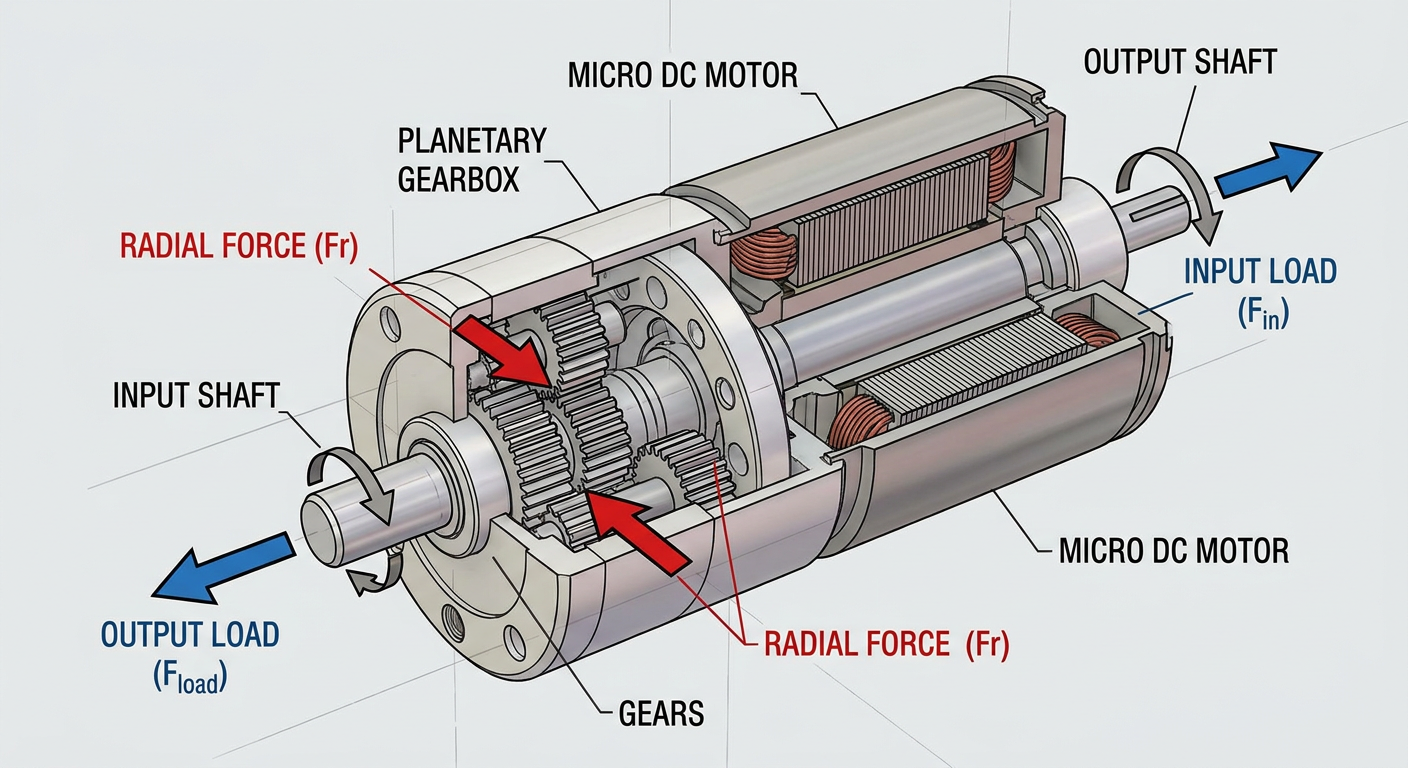
For micro motors in the 4 mm to 42 mm diameter range, the mechanical interface is usually the hardest part. Shaft diameters of 0.7 mm to 1 mm leave little room for a coupling that is both concentric and removable. A slight misalignment adds a radial load the application will never see, and that load can dominate bearing wear. The fixture should be checked for runout after every motor change, not only at the start of the campaign.
Load application depends on the motor type:
Brushed DC and BLDC shaft motors are typically loaded with a magnetic particle brake, a hysteresis brake, or a small generator with a resistive load. A brake that holds torque constant across the speed range is preferable when the mission profile includes speed changes.
Coin vibration motors (ERM), including the compact coin LRA vibration motor formats, are loaded by their own eccentric mass or moving mass. The relevant load is the vibration amplitude and the mechanical constraint of the mounting, so the fixture must reproduce the compliance of the real product housing. Testing a coin motor clamped rigidly in aluminum tells you about a motor in aluminum, not about a motor in a phone or a wearable.
Linear resonant actuators (LRA) are driven at resonance, and their output depends on the drive frequency relative to the mechanical resonance of the mass-spring system. The fixture must hold the LRA the way the product does, and the drive electronics must track resonance as it shifts with temperature and wear.
Dynamometer selection follows the same logic. The instrument’s full-scale range should sit close to the expected operating torque; a dynamometer rated at ten times the test torque spends its life in the least accurate part of its range.
Sensors, calibration, and data integrity
A life test can run for thousands of hours. Sensors that were accurate on day one may not be accurate on day ninety, and the failure that matters may be a slow drift rather than a step change.
The measurement set for a typical micro motor life bench includes:
Parameter | Typical instrument | Why it matters for life data |
|---|---|---|
Current | Shunt or Hall current sensor | Rising current at constant load is an early wear indicator, especially for brushed motors |
Speed | Optical encoder or tachometer | Speed loss signals friction growth before hard failure |
Torque / load | Brake reaction torque or in-line torque sensor | Confirms the duty profile was actually applied |
Winding temperature | Thermocouple or resistance method | Thermal history drives insulation and lubricant life |
Vibration | Accelerometer on the fixture | Detects bearing degradation and imbalance |
Supply voltage | Bench-level DAQ channel | Separates motor behavior from supply variation |
Calibration should be traceable and scheduled on a fixed interval, with the interval chosen so that drift between calibrations stays well inside the tolerance that matters for the pass/fail criteria. A mid-campaign calibration check on a reference motor or a fixed resistor is a cheap way to catch a drifting channel before it contaminates months of data.
Data integrity is mostly about timestamp discipline. Every sample needs a timestamp from a single clock, and every intervention — a motor change, a calibration, a power interruption — needs to be logged against that clock. When a test is later analyzed with survival methods, an unlogged gap becomes an ambiguous censoring event. Automated logging with an immutable audit trail is worth more than a more precise sensor with manual record-keeping.
Pro Tip Run a reference unit alongside the test samples. A motor of known behavior, or a fixed electrical load, gives you a continuous check that the bench itself has not changed.
Controller-in-the-loop practices
BLDC and LRA life tests cannot be separated from the drive electronics. The motor’s electrical and thermal stress depends on how the controller commutates it, and the controller’s behavior can change as the motor wears.
Controller-in-the-loop testing means the actual production driver, or a faithful bench equivalent, runs the motor through the mission profile while the data system records both motor and controller states. This matters for several reasons:
Commutation timing affects current waveform and heating. A bench that drives a BLDC motor with a generic ESC may produce a different thermal profile than the OEM’s own driver.
Closed-loop speed control will increase current as friction rises, which changes the stress trajectory. An open-loop bench test would show a speed drop instead. Both are valid, but they answer different questions.
Fault behavior — overcurrent trips, stall detection, restart attempts — is part of the real duty cycle and should be captured, not bypassed.
In practice, controller-in-the-loop setups also make failure detection more realistic. A motor that no longer starts under load but still spins when nudged may pass a crude continuity check and fail a proper functional test.
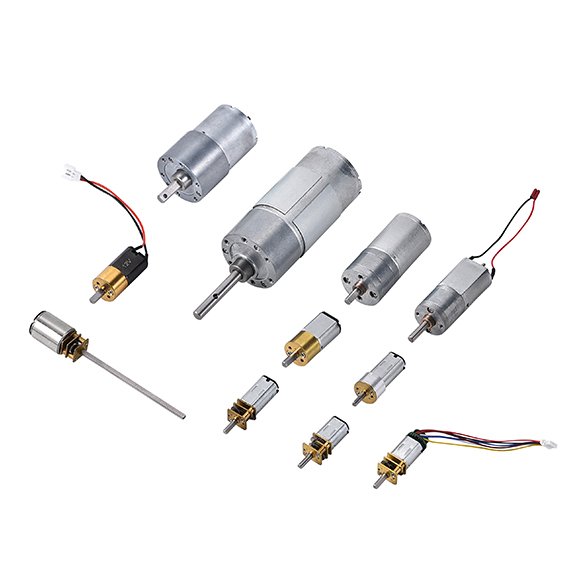
This is the stage where supplier engineering support earns its place. INEED Motors builds and tests micro DC motors, BLDC motors, and coin vibration motors, and its diameter coverage is specific to each family: micro DC motors from 4 mm to 42 mm, coin vibration motors from 7 mm to 12 mm, BLDC coin vibration motors from 5 mm to 12 mm, and LRA coin vibration motors from 6 mm to 20 mm. Its production process includes motor lifetime testing alongside BLDC motor testing, commutator checks, noise testing, and on-load testing. For an OEM team, the practical value is not a laboratory tour but a shared reference point: the supplier’s test conditions, fixture practice, and failure criteria can be compared with the OEM’s own bench before a qualification campaign starts, so that discrepancies surface in weeks rather than after a multi-month test. The same engineering team also supports custom shafts, lead wires, connectors, and encoders, which means the test sample can be built to the same configuration that will ship.
Warning A life test run on a bench motor with a different shaft, bearing, or lubricant than the production part tests a different product. Freeze the configuration before the campaign begins.
Duty Profiles and Stress Conditions
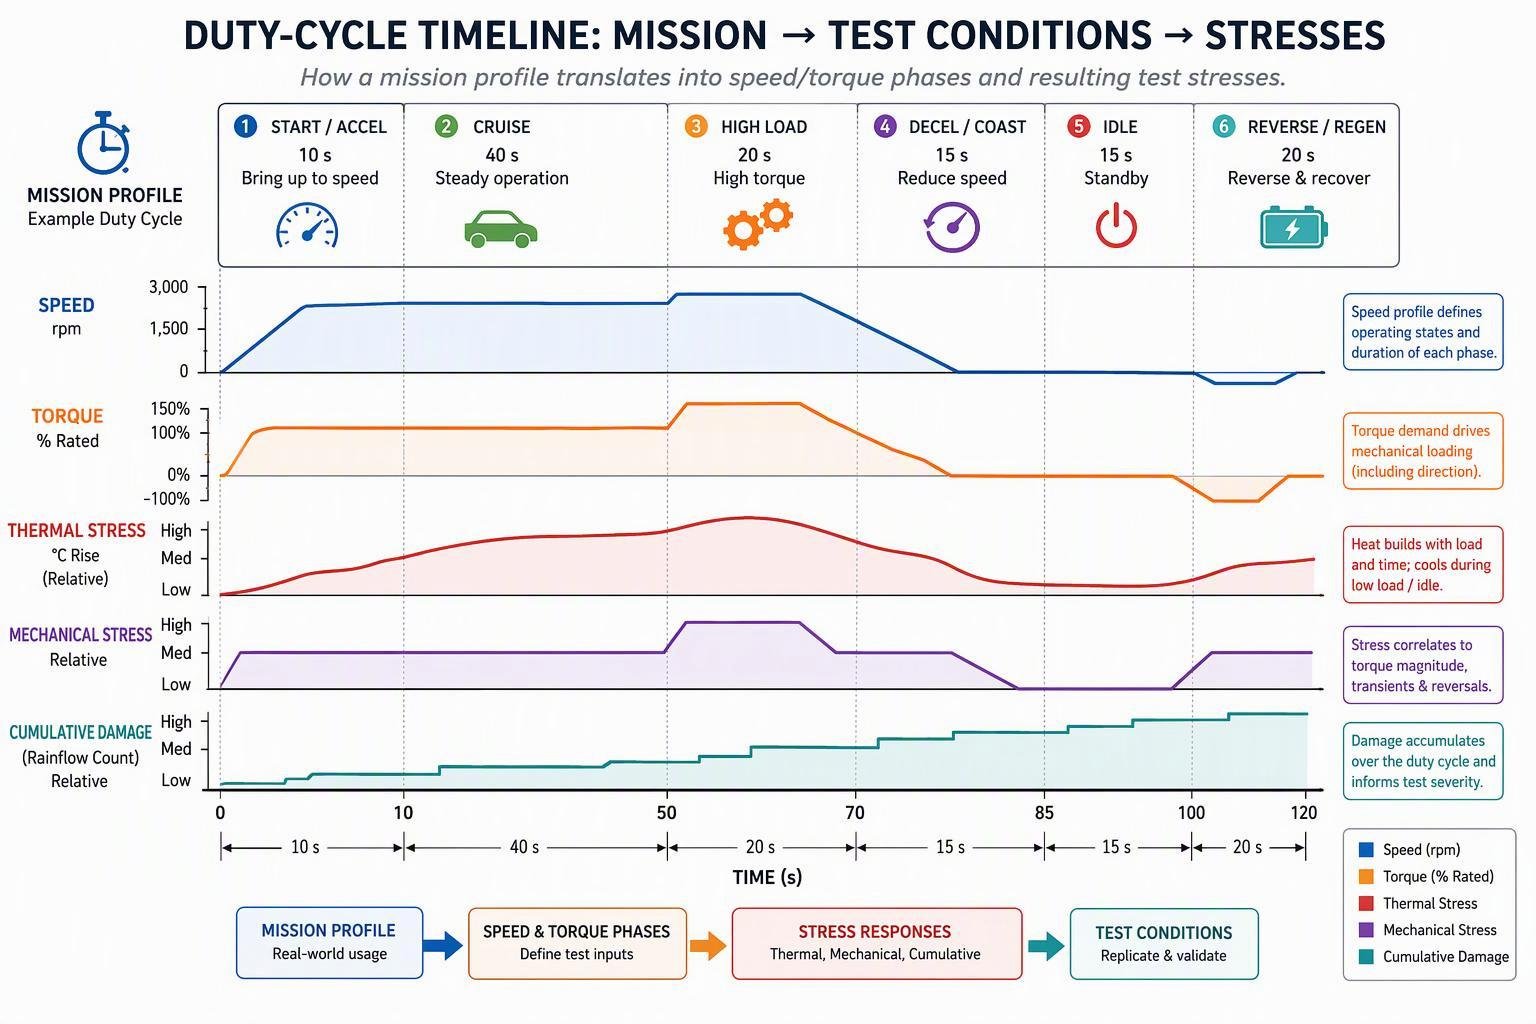
A life test is only meaningful relative to a defined duty. The same motor can last a few hundred hours in one application and tens of thousands in another, and both numbers can be correct.
Application mission profiles (S1–S8 types)
The IEC 60034-1 duty type framework gives a common vocabulary for describing how a motor is loaded over time. The standard defines a series of duty types, from continuous running at constant load through to intermittent and periodic duties with starting, braking, and rest periods. The commonly cited types include:
Duty type | Description in brief | Typical micro motor example |
|---|---|---|
S1 | Continuous duty at constant load | Pump or fan motor running for the full on-period |
S2 | Short-time duty | Door lock actuator energized for a few seconds |
S3 | Intermittent periodic duty | Tool or appliance motor with regular on/off cycles |
S4 | Intermittent periodic duty with starting | Motor that starts, runs, and stops repeatedly under load |
S5 | Intermittent periodic duty with electric braking | Positioning axis with active braking |
S6 | Continuous-operation periodic duty | Repeated load cycles without a rest period |
S7 | Continuous-operation periodic duty with electric braking | Reversing drive with braking each cycle |
S8 | Continuous-operation periodic duty with related load/speed changes | Multi-speed or multi-load machine cycle |
Two cautions apply when borrowing this framework for micro motors. First, IEC 60034-1 is written for rotating electrical machines generally, and its duty definitions are a classification vocabulary, not a test recipe for a 6 mm coin motor. Second, the standard’s own thermal test provisions — the resistance method, embedded temperature detector method, and thermometer method for determining winding temperature — are the parts most directly useful to a micro motor life test, because they define how to measure the temperature that drives so much of the wear.
In practice, an OEM mission profile is usually a composite, and it often mixes motor families in one product. A wearable might fire a BLDC coin vibration motor for a haptic alert, then run a tiny pump for a few seconds — one device, two duty profiles, two separate life claims. The engineer’s job is to translate that into a repeating bench cycle with defined on-times, off-times, load levels, and ambient conditions, and to state which S-type (or combination) it approximates.
Electrical, mechanical, and thermal stresses
The stresses that drive micro motor wear fall into three groups, and they interact.
Electrical stress includes supply voltage level and variation, inrush current at start, commutation transients in brushed motors, and PWM ripple in driven BLDC and LRA systems. Voltage above the rated value increases current and heating; voltage below it can prevent reliable starting, which produces repeated stall attempts and their own damage pattern.
Mechanical stress includes load torque, radial and axial shaft loads from couplings and gears, vibration transmitted through the mounting, and for ERM and LRA motors, the cyclic load of the moving mass itself. Brush pressure and commutator film formation in brushed motors are sensitive to current density and speed, so a test that runs at a different speed than the application changes the wear mechanism.
Thermal stress is often the integrating variable. Winding insulation, lubricant viscosity and breakdown, and magnet strength all depend on temperature, and temperature depends on the electrical and mechanical losses, the duty cycle’s on/off ratio, and the ambient. A motor that runs continuously at moderate load may reach a higher winding temperature than one that runs harder for shorter periods.
These stresses are not independent. Higher temperature softens lubricant, which raises friction, which raises current, which raises temperature further. A life test that holds only one variable constant may miss the runaway path that dominates field failure.
Acceleration models preserving mechanisms
Accelerated life testing trades time for stress. The trade is only valid if the higher stress accelerates the same failure mechanism that limits life at use conditions, rather than introducing a different one.
The common models each map to a family of mechanisms:
Arrhenius relates time to failure to temperature, with the acceleration factor between two temperatures depending on an activation energy. It applies to chemical and diffusion-driven mechanisms — lubricant degradation, insulation aging, corrosion. The NIST/SEMATECH handbook notes activation energies typically ranging from about 0.3–0.4 eV up to 1.5 eV or higher, and that the acceleration factor grows exponentially with activation energy. Using the wrong activation energy can overstate acceleration by orders of magnitude.
Inverse power rule and exponential voltage models relate life to voltage stress and are used for electrical mechanisms.
Coffin-Manson relates cycles to failure for fatigue mechanisms, with terms for cycling frequency and temperature range. It is the appropriate family for solder fatigue and for mechanical crack growth under thermal cycling.
Combined models add voltage and humidity terms to the Arrhenius core when several stresses act together.
The practical rule is to identify the dominant failure mechanism first, then choose the model that the literature associates with it, then verify the model against data at more than one stress level. A single accelerated stress point cannot validate an acceleration model; it can only produce a number whose extrapolation is unverified.
Acceleration also has limits. Running a brushed motor at twice its rated voltage may accelerate brush wear, but it may also cause commutator arcing that does not occur at the rated voltage, producing a failure mode the field will never see. The test then measures the wrong thing quickly. Where the mechanism cannot be accelerated without changing, a longer test at or near use stress is the honest choice.
Key Takeaway Acceleration is valid only when the failure mechanism is preserved. Confirm the mechanism by teardown at the accelerated stress before extrapolating to use conditions.
Reliability Analysis and Models
Life data from micro motors is almost never complete. Some units fail during the campaign; others are still running when the test ends, are removed for teardown, or are lost to a bench fault. The analysis method must handle both failures and censored observations.
Zero-failure sample sizes calculated from the binomial success-run formula n = ⌈ln(1 − C)/ln(R)⌉. Only the 0.90 reliability / 0.90 confidence row (22 units) is stated in the cited source; the other rows are arithmetic from the same formula. The plan holds only if every unit passes.
Weibull percentile life, confidence, and diagnostics
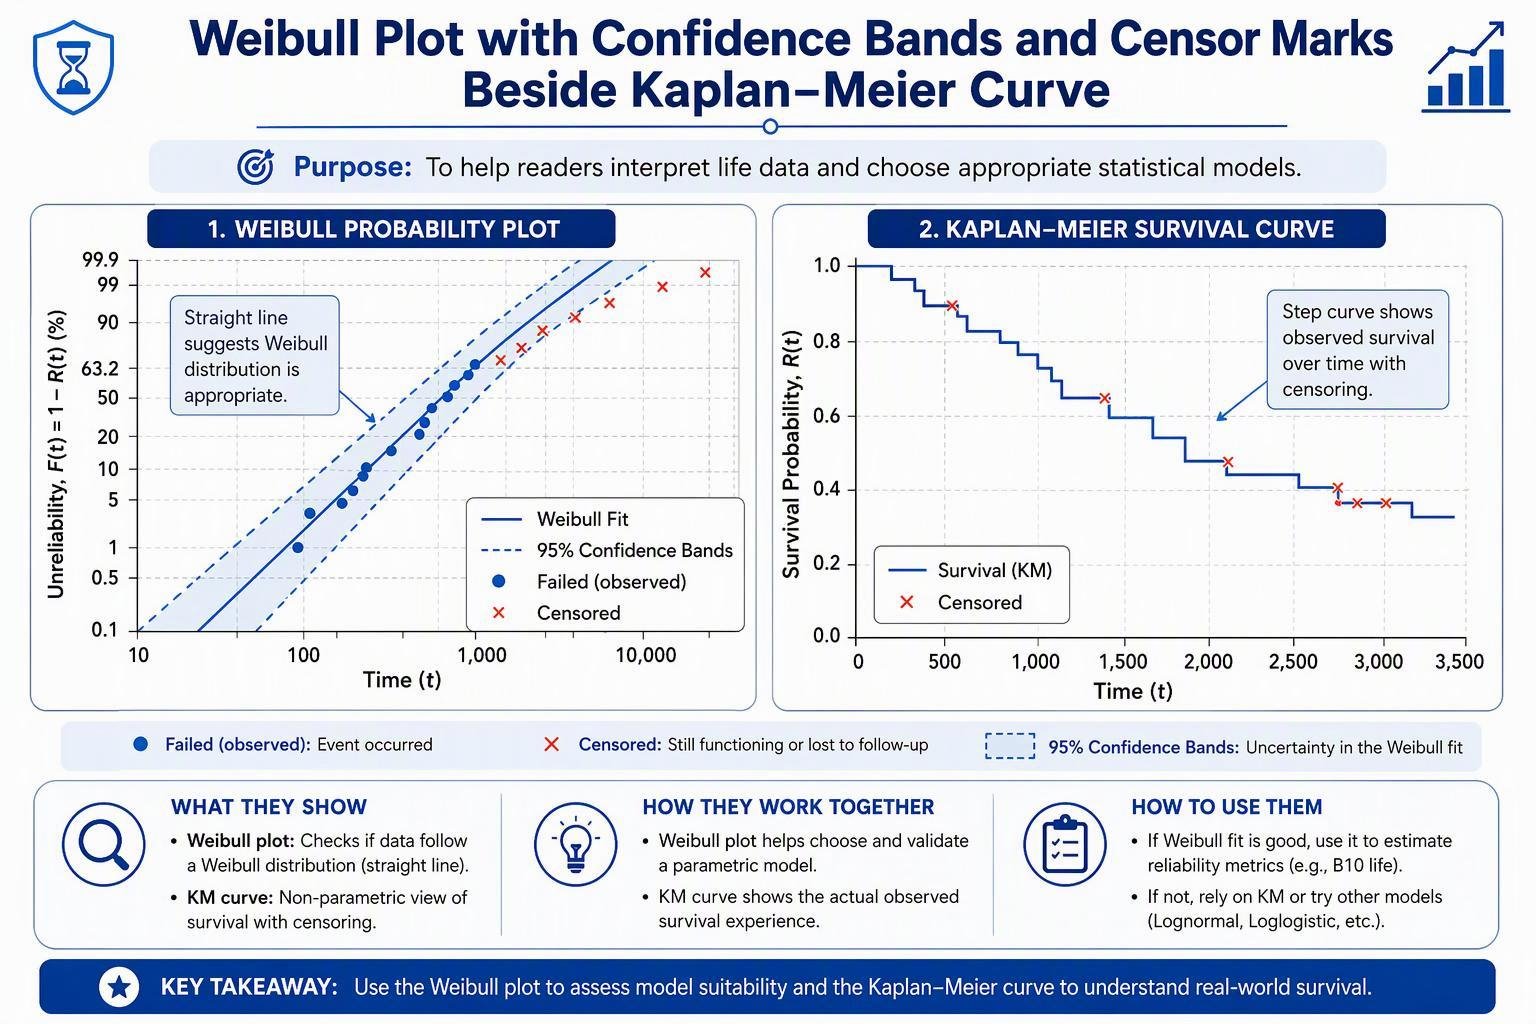
The Weibull distribution is the default choice for wear-out data because its shape parameter distinguishes early-life, random, and wear-out behavior. For a two-parameter Weibull, the reliability at time t is R(t) = exp[−(t/η)^β], where η is the scale parameter (the time at which 63.2% of units have failed) and β is the shape.
The B10 life — the time by which 10% of units are expected to fail, also written L10 — follows from inverting that expression: B10 = η × (−ln 0.9)^(1/β). B10 is the number most OEM qualification programs should be built around, because it describes the early tail of the failure distribution rather than the average.
A point estimate of B10 is not a qualification result. It needs confidence bounds. For a given reliability, a one-sided lower confidence bound on the time at which that reliability is reached tells the reader how much the data actually supports. The choice of method matters at small sample sizes: the Fisher matrix approach is standard, while likelihood ratio bounds are often preferred when sample sizes are small, as ReliaSoft’s reference notes.
Diagnostics matter as much as the fit:
Shape parameter plausibility. A β well below 1 suggests infant mortality dominating, which may mean the test is measuring manufacturing defects rather than wear-out. A β around 1 suggests random failures and a possible mismatch between the test and the intended mechanism.
Plot linearity. Points that curve on a Weibull probability plot indicate a mixture of mechanisms or a changing stress.
Residual pattern. Systematic deviation at the early percentiles is exactly where B10 lives, so it deserves attention.
Kaplan–Meier survival and censored data handling
The Kaplan–Meier estimator gives an empirical survival curve without assuming a distribution. The NIST handbook describes the procedure: order the failure times, and at each failure time multiply the running survival estimate by (nᵢ − 1)/nᵢ, where nᵢ is the number of units still operating just before that failure. Units removed from test before failing count in nᵢ up to the last failure before their removal, and not after.
For micro motor testing, Kaplan–Meier is useful in three situations:
Early campaign reads. Before enough failures accumulate to fit a Weibull model, the K-M curve gives an honest picture of what has been observed.
Mixed populations. If the sample includes units from two production lots or two lubricant variants, the K-M curves can be compared before committing to a parametric model.
Suspected mechanism change. A K-M curve that flattens or steepens partway through the test is a signal to investigate.
The critical discipline is that censored units must not be discarded. A unit that ran 4,000 hours without failing carries real information: it survived at least 4,000 hours. Deleting it biases the result toward early failures and understates life. The same applies to units removed for teardown — record the removal time and treat it as censored, not as missing.
For probability plotting, the standard K-M estimate has a known pessimistic bias at the last failure, where the estimate drops to zero. Modified K-M estimates, which reduce to median rank estimates for Type I censored data, are better suited to graphical presentation.
Sample size planning and zero-failure bounds
Sample size is where test cost and statistical credibility meet. Two approaches cover most micro motor programs.
Success-run (zero-failure) plans. If the requirement is to demonstrate a reliability R at confidence C with no failures allowed, the binomial success-run formula gives n = ln(1 − C) / ln(R). The commonly cited 95/95 requirement — 95% reliability at 95% confidence with zero failures — needs ln(0.05)/ln(0.95) ≈ 58.4, so 59 units. Thirty units that all pass demonstrate about 92.6% reliability at 90% confidence. The plan holds only if every unit passes; a single failure means the demonstration has not been made, and a plan that tolerates failures needs a different calculation.
Exponential/MTBF test length plans. Where the requirement is expressed as MTBF, the NIST test length table gives multipliers on the MTBF objective for a chosen number of allowed failures and confidence level. For example, confirming a 200-hour MTBF objective at 90% confidence with up to four failures allowed requires 200 × 7.99 ≈ 1,598 hours; allowing no failures requires 200 × 2.30 = 460 hours. The shorter zero-failure test is less fair to the supplier, because a marginally acceptable product has a higher chance of failing by chance. Test time can be shortened by running units in parallel, since total test time is the sum of all unit-hours.
Weibull-based plans. When a shape parameter can be assumed or estimated, parametric binomial plans let a smaller sample demonstrate reliability at a specified mission time. This is where prior data — from an earlier campaign, a similar motor, or a supplier’s historical test — pays for itself.
A practical caution on very small samples: success-run plans with a handful of units can demonstrate only modest reliability. A test with six units and zero failures supports a much weaker claim than the same test with sixty. The sample size should be chosen from the claim the OEM intends to make, not from the number of motors left in the prototype box.
Pro Tip Decide the statistical claim before the test. Retrofitting a confidence statement onto data collected for a different purpose is where most qualification packages become indefensible.
Reporting and Compliance Alignment
The final stage converts bench data into a document that a customer, auditor, or regulator can evaluate. The test is not finished when the last motor stops; it is finished when the result is reported in a form that supports a decision.
Worked reports you can download
Method sections are easier to apply when there is a finished document to compare against. Two lifespan testing reports are available as PDF downloads: one for a BLDC coin vibration motor and one for a micro LRA vibration motor. Read either one next to the sections above and the structure should look familiar: configuration, test setup, duty profile, measured parameters, failure criteria, results, and the conclusion with its stated limitations.
A practical way to use them: take the report whose motor type is closest to your application and use its section headings as the skeleton of your own dossier. Where your program produces less evidence than the report does — no teardown photos, no confidence bounds, an unlogged duty profile — that gap is the first thing a customer audit will find, and it is cheaper to close before the campaign starts than afterward.
Qualification dossier and visualization templates
A qualification dossier for a micro motor life test should contain, at minimum:
Configuration record. Part number, revision, shaft, bearing, lubricant, lead wire, connector, and any encoder or gearbox fitted to the test samples, with a statement of how this compares to the production configuration.
Test setup description. Fixture drawing or photograph, load type and range, drive electronics, ambient conditions, and mounting compliance.
Duty profile definition. The applied cycle in tabular and graphical form, with on-times, off-times, load levels, speeds, voltages, and the S-type it approximates.
Measurement and calibration record. Sensor list, ranges, calibration certificates and dates, and the data logging interval.
Raw data and event log. Time-stamped records, including interventions, calibrations, and power interruptions.
Failure criteria and observed failures. The definition of failure used, the time and mode of each failure, and the treatment of censored units.
Statistical analysis. Method, assumptions, parameter estimates, confidence bounds, and diagnostic plots.
Teardown findings. Photographs and measurements for failed and surviving units.
Conclusion and limitations. What the data support, what they do not, and the conditions under which the result applies.
Visualization should serve the reader’s decision. A Weibull probability plot with confidence bands and censor marks shows both the fit and the evidence behind it. A survival curve shows the observed data without distributional assumptions. A time-series plot of current, speed, and temperature for a representative unit shows how failure developed, which is often more persuasive to a design engineer than the summary statistics. A table of B10 estimates with lower confidence bounds, by configuration and duty profile, is the form most procurement and quality teams can act on.
Mapping to IEC/ISO standards and EMC/safety
Micro motor life testing sits at the intersection of several standards families, and the dossier should state which apply and how.
Motor rating and performance. IEC 60034-1 covers rating and performance for rotating electrical machines, including duty types and thermal test methods. IEC 60034-2-1 covers methods for determining losses and efficiency from tests and applies to DC machines as well as AC machines within the scope of IEC 60034-1. Both are written for machines generally, so a micro motor program should cite the clauses it actually uses rather than claiming blanket conformity.
Environmental testing. IEC 60068 series methods cover low temperature, high temperature, damp heat steady state, temperature change, sinusoidal and random vibration, shock, and bump. These are the standard tools for the environmental portion of a qualification, and they are commonly referenced alongside a life test rather than instead of one.
EMC. Motor drive systems are a known source of conducted and radiated emissions, and the controller is part of the tested system. STMicroelectronics’ application note on EMC design for motor control identifies IEC 61000-4-2 (ESD) and IEC 61000-4-4 (electrical fast transient/burst) as principal immunity standards and stresses that EMC compliance should be designed in from the start rather than remediated afterward. For a life test, the practical implication is that the drive electronics used on the bench should be the production design or an EMC-equivalent, so that the electrical stress seen by the motor matches the shipped system.
Medical and safety. Where the end product is medical, IEC 60601-1 is the general safety standard, and it is recognized by the US FDA with US national differences applied. Motor life data alone does not establish compliance with IEC 60601-1, but it can support the reliability and essential performance arguments within a submission.
Materials compliance. RoHS and REACH declarations belong in the dossier as separate documents. They are not life test results, and mixing them into the reliability section creates confusion about what was actually tested.
A useful discipline is a standards mapping table in the dossier: standard, edition, clause, what it was applied to, and the evidence produced. This makes gaps visible before an auditor finds them.
Failure modes, criteria, and teardown documentation
The definition of failure is a design decision, and it should be written down before the test starts.
For micro motors, common failure modes include:
Brushed motors: brush wear to the point of poor commutation, commutator film breakdown, brush spring relaxation, bearing or bushing wear, lubricant depletion.
BLDC motors: bearing wear, magnet degradation at high temperature, winding insulation failure, hall sensor or driver failure where integrated.
ERM coin motors: bushing wear at the eccentric weight, increased vibration noise, reduced amplitude, mechanical interference.
LRA motors: suspension spring fatigue, mass detachment, resonance shift beyond the driver’s tracking range, reduced acceleration output.
Failure criteria should be quantitative and tied to the application. Examples: output speed falls below 80% of the initial value at rated load; current rises above 130% of the initial value at constant load; vibration amplitude falls below the application’s minimum perceptible level; the motor fails to start from rest under load on three consecutive attempts. A criterion based on the application’s functional requirement is stronger than one based on an arbitrary percentage.
Teardown documentation turns a failure time into a failure mechanism. For each failed unit, record the disassembly sequence, photographs at each stage, measurements of wear surfaces, lubricant condition, and any debris. For a sample of surviving units, the same teardown shows how far wear had progressed at the censoring time, which is valuable evidence that the test was actually exercising the intended mechanism.
Key Takeaway A failure time without a failure mechanism is a data point. A failure time with a documented mechanism is evidence that the test measured what it claimed to measure.
Conclusion
Micro motor lifespan testing is often summarized with a single MTBF figure, and that figure is frequently misread. MTBF is the reciprocal of a constant failure rate, and it is a useful measure of the random-failure portion of a bathtub curve. It is not a life expectancy. As ZVEI’s guidance on MTBF points out, a power supply with a million-hour MTBF will not last 114 years, and the product with the highest MTBF is not necessarily the most reliable in service. For a wear-out mechanism — which is what limits most micro motors — the average is the wrong statistic.
The alternative is a confidence-bounded percentile life. A statement such as “B10 life of 8,000 hours at 90% confidence, lower bound 6,200 hours, under duty profile X” tells a design team what it needs: the time by which 10% of units are expected to fail, with an explicit statement of how much the data support that number. That is a claim a warranty model, a service interval, and a customer qualification review can all use.
Three practices make that claim defensible:
Align the test to the mission profile. The duty cycle, load, ambient, and drive electronics on the bench should match the application, or the acceleration model should explicitly and defensibly bridge the difference. A test at rated continuous load says little about a device that runs for 200 ms at a time.
Preserve the failure mechanism. Acceleration is valid only when the higher stress drives the same wear process. Teardown at the accelerated condition is the check that keeps an extrapolation honest.
Report in a standardized form. A dossier with configuration, setup, duty profile, calibration, raw data, failure criteria, statistics with confidence bounds, and teardown findings reduces the back-and-forth that delays OEM qualification decisions. It also makes comparisons between suppliers meaningful, because the reader can see whether the tests were comparable.
For OEM engineering teams, the payoff is not only a better number. It is a shorter path from prototype to production release, because the reliability argument is settled once, with evidence, rather than re-litigated at each design review. If you’d rather not build the bench from scratch, INEED Motors runs life testing on its own production motors and can share the conditions behind the data. The two worked reports available for download — the BLDC coin vibration motor and the micro LRA vibration motor — are intended to show that standardized form in practice, and to give OEM teams a template they can hold their own test data against.
FAQ
How long does a micro motor lifespan test have to run? There’s no fixed number, because the answer depends on the claim you want to make. A success-run plan that allows zero failures needs enough unit-hours to reach the target reliability at the chosen confidence, so the calendar time falls as soon as you run samples in parallel. A test expressed as an MTBF objective follows the NIST test length table, where the multiplier depends on how many failures you’re willing to tolerate. Decide the claim first, then work backward to hours.
How many motors do I need to test? Fewer than most teams assume, and more than many prototypes leave in the box. Demonstrating 95% reliability at 95% confidence with no failures allowed takes 59 units; 30 units that all pass support only about 92.6% at 90% confidence. If you have prior data on the same motor family, a Weibull-based plan can get the same claim with a smaller sample. The number should come from the claim, not the shelf.
Can I use MTBF as the headline life figure? You can report it, but don’t present it as life expectancy. MTBF is the reciprocal of a constant failure rate, so it describes the random-failure portion of the bathtub curve. Most micro motors are limited by wear-out, which MTBF flattens into a misleading average. A confidence-bounded B10 with a stated duty profile is what a warranty model or a qualification review can actually use.
What documentation should I request from a motor supplier? Ask for the test configuration, the duty profile, the calibration record, the failure criteria, the statistical method with confidence bounds, and teardown findings for both failed and surviving units. Also confirm the test samples match the shipping configuration — shaft, bearing, lubricant, lead wires, and any encoder. If a supplier’s report is thinner than that, the gap is what a customer audit will ask about later.